Market Outlook
December 1, 2017
Market Cues
Domestic Indices
Chg (%)
(Pts)
(Close)
Indian markets are likely to open flat tracking global indices and SGX Nifty.
BSE Sensex
(1.3)
(453)
33,149
The US stocks moved mostly higher during trading on Thursday following the mixed
Nifty
(1.3)
(135)
10,227
performance seen in the previous session. With the upward move on the day, the
Mid Cap
(0.5)
(93)
16,917
Dow and the S&P 500 reached new record closing highs. The major averages
Small Cap
0.1
18
18,229
finished the day firmly in positive territory but off their highs of the session. The Dow
Bankex
(1.9)
(549)
28,631
surged up 1.4% to 24,272, the Nasdaq climbed 0.7% to 6,874 and the S&P 500
advanced 0.8% to 2,648.
Global Indices
Chg (%)
(Pts)
(Close)
The UK shares fell for a second consecutive session on Thursday as the pound
continued to surge amid further signs of progress on the EU's key Brexit issues,
Dow Jones
1.4
332
24,272
including the Irish border. The benchmark FTSE 100 was down 0.9 percent at 7,327
Nasdaq
0.7
50
6,874
by close of the day.
FTSE
(0.9)
(67)
7,327
Nikkei
0.6
128
22,725
BSE Sensex and NSE Nifty closed over 1% lower on Thursday after India’s fiscal
deficit at the end of October hit 96.1% of the budget estimate for the fiscal year
Hang Seng
(1.5)
(446)
29,177
ending in March 2018. It was their biggest single-day fall in two months as investors
Shanghai Com
(0.6)
(21)
3,317
also cut down on their bets ahead of the September quarter GDP data. The 30-
share Sensex shut the shop down over 450 points, or 1.35%, at 33,149, while the
Advances / Declines
BSE
NSE
50-share NSE Nifty index settled with loss of nearly 135 points, or 1.30 %, at
Advances
1,211
696
10,226.
Declines
1,494
1,032
News Analysis
Unchanged
141
68
2Q GDP indicates growth rebounding in the economy
Endurance Technologies - CMP 1265 Target Price 1,285, Book profit
Volumes (` Cr)
Detailed analysis on Pg2
BSE
4,369
NSE
49,597
Investor’s Ready Reckoner
Key Domestic & Global Indicators
Net Inflows (` Cr)
Net
Mtd
Ytd
Stock Watch: Latest investment recommendations on 150+ stocks
FII
784
20,405
58,858
Refer Pg5 onwards
MFs
300
10,669
106,079
Top Picks
CMP
Target
Upside
Top Gainers
Price (`)
Chg (%)
Company
Sector
Rating
(`)
(`)
(%)
Rtnpower
9
10.0
Blue Star
Capital Goods
Buy
739
867
17.3
Dewan Housing Finance
Financials
Buy
617
712
15.5
Mcleodruss
235
7.1
Asian Granito
Other
Accumulate
509
570
12.0
Den
99
7.0
Navkar Corporation
Other
Buy
188
265
41.3
Sobha
623
5.5
KEI Industries
Capital Goods Accumulate
397
425
7.1
Bomdyeing
221
4.7
More Top Picks on Pg4
Key Upcoming Events
Top Losers
Price (`)
Chg (%)
Previous
Consensus
Date
Region
Event Description
Sreinfra
102
(6.2)
Reading
Expectations
Nov30
Germany PMI Services
54.90
Suzlon
14
(3.8)
Nov30
Germany PMI Manufacturing
62.50
62.50
Adanitrans
183
(3.7)
Nov30
UK
PMI Manufacturing
56.30
56.50
Apollotyre
251
(3.1)
Dec01
Euro Zone Euro-Zone GDP s.a. (QoQ)
0.60
Gppl
143
(3.1)
Dec01
India
RBI Reverse Repo rate
5.75
5.75
As on November, 30 2017
More Events on Pg7
Market Outlook
December 1, 2017
News Analysis
2Q GDP indicates growth rebounding in the economy
India’s 2QFY18 GDP growth at 6.3% (vs. consensus 6.4% ) has shown a that
economy is coming back to the growth path. In 1QFY18, GDP growth was 5.7%
so at 6.3%, we believe that the economy has clearly shown its trajectory which is
the most important thing at the moment. The recovery is also reflected in GVA
numbers which grew by 6.1% in the 2QFY18 vs. 5.6% in 1QFY18. The rebound is
seen in the electricity, manufacturing, construction and mining sectors whereas
services sector is yet to recover.
The numbers clearly indicate that economy is slowly coming out of the impact of
the demonetization and GST. With the lower base of third and fourth quarter and
with ongoing recovery, we believe that second half GDP numbers are likely to be
far better than first half and we believe that FY18 GDP growth is likely to be
around 7%.
Endurance Technologies - CMP `1,265 Target Price `1,285, book
profit
Endurance Technologies, the largest domestic 2W auto ancillary put a robust show
in the 2QFY18. Consolidated sales grew 12% while bottom-line grew by 11.6%
due to the higher tax rate in the quarter. The EBITDA margin was at 14.5% vs.
14.1% in 1QFY18 and 13.9% in 2QFY17. Domestic business grew 10.4% while
European business grew by 16% yoy. The European business saw ~200bps
margin expansion while domestic business margins expanded by
~20bps.
Company continues to maintain ~8-10% growth guidance and has indicated that
it is in position to start ABS supplies from 1QFY20. While we like the company,
recent price run up has left no room for upgrade the rating. While we raise our
price target to `1,285, we downgrade the stock to neutral. One should book profit
in the scrip at the CMP.
Economic and Political News
IMF to update India growth rate forecast in January
RBI given ammunition to hold rates as economy recovers
Manufacturing shrugs off GST, demonetisation blues
OPEC agrees extended oil supply cut for full 2018
Economy scripts a turnaround, expands 6.3% in Q2
Corporate News
MCX completes first settlement cycle in options contract on gold futures.
Laurus Labs receives tentative approval from USFDA for Tenofovir Disoproxil
Fumarate.
Reliance Power executes a pact for 750 MW in Bangladesh.
LIC to pare stake in Bank of Baroda to 5.2 percent from 7.2 percent
Market Outlook
December 1, 2017
Top Picks HHHHH
Market Cap
CMP
Target
Upside
Company
Rationale
(` Cr)
(`)
(`)
(%)
Strong growth in domestic business due to its leade`hip
in acute therapeutic segment. Alkem expects to launch
Alkem Laboratories
23,759
1,987
2,125
6.9
more products in USA, which bodes for its international
business.
We expect the company would report strong profitability
Asian Granito
1,531
509
570
12.0
owing to better product mix, higher B2C sales and
amalgamation synergy.
Favorable outlook for the AC industry to augur well for
Cooling products business which is out pacing the
Blue Star
7,085
739
867
17.3
market growth. EMPPAC division's profitability to
improve once operating environment turns around.
With a focus on the low and medium income (LMI)
consumer segment, the company has increased its
Dewan Housing Finance
19,335
617
712
15.5
presence in tier-II & III cities where the growth
opportunity is immense.
Loan growth is likely to pick up after a sluggish FY17.
Lower credit cost will help in strong bottom-line growth.
Karur Vysya Bank
6,883
114
180
58.0
Increasing share of CASA will help in NIM
improvement.
High order book execution in EPC segment, rising B2C
KEI Industries
3,111
397
425
7.1
sales and higher exports to boost the revenues and
profitability
Expected to benefit from the lower capex requirement
Music Broadcast
2,178
382
434
13.7
and 15 year long radio broadcast licensing.
Massive capacity expansion along with rail advantage
Navkar Corporation
2,822
188
265
41.3
at ICD as well CFS augur well for the company
Strong brands and distribution network would boost
Siyaram Silk Mills
3,105
662
700
5.7
growth going ahead. Stock currently trades at an
inexpensive valuation.
Market leadership in Hindi news genre and no.
2
viewership ranking in English news genre, exit from the
TV Today Network
2,357
395
435
10.1
radio business, and anticipated growth in ad spends by
corporate to benefit the stock.
After GST, the company is expected to see higher
volumes along with improving product mix. The Gujarat
Maruti Suzuki
2,59,858
8,602
9,489
10.3
plant will also enable higher operating leverage which
will be margin accretive.
We expect loan book to grow at 24.3% over next two
GIC Housing
2,372
440
655
48.7
year; change in borrowing mix will help in NIM
improvement
We expect CPIL to report net Revenue/PAT CAGR of
~17%/16% over FY2017-20E mainly due to healthy
7046
317
399
25.9
growth in plywood & lamination business, forayed into
Century Plyboards India
MDF & Particle boards on back of strong brand &
distribution network.
We expect sales/PAT to grow at 13.5%/20% over next
LT Foods
1875
70
96
37
two years on the back of strong distribution network &
addition of new products in portfolio.
Source: Company, Angel Research
Market Outlook
December 1, 2017
Key Upcoming Events
Result Calendar
Date
Company
November 14, 2017
Tata Global, JK Tyre, CEAT, Jyoti Structures, Bank of Baroda, Reliance Capital, Corporation Bank, MOIL
November 15, 2017
Automotive Axle
Source: Bloomberg, Angel Research
Global economic events release calendar
Bloomberg Data
Date
Time
Country
Event Description
Unit
Period
Last Reported
Estimated
Dec 01, 2017
2:25 PMGermany PMI Services
Value
Nov F
54.90
2:25 PMGermany PMI Manufacturing
Value
Nov F
62.50
62.50
Dec 05, 2017
3:00 PMUK
PMI Manufacturing
Value
Nov
56.30
56.50
3:30 PMEuro Zone Euro-Zone GDP s.a. (QoQ)
% Change
3Q F
0.60
Dec 06, 2017
2:30 PMIndia
RBI Reverse Repo rate
%
Dec 6
5.75
5.75
2:30 PMIndia
RBI Repo rate
%
Dec 6
6.00
6.00
2:30 PMIndia
RBI Cash Reserve ratio
%
Dec 6
4.00
4.00
Dec 08, 2017
3:00 PMUK
Industrial Production (YoY)
% Change
Oct
2.50
India
Imports YoY%
% Change
Nov
7.60
India
Exports YoY%
% Change
Nov
(1.10)
China
Exports YoY%
% Change
Nov
6.90
7:00 PMUS
Change in Nonfarm payrolls
Thousands
Nov
261.00
198.00
7:00 AMChina
Consumer Price Index (YoY)
% Change
Nov
1.90
1.80
Dec 09, 2017
7:00 PMUS
Unnemployment rate
%
Nov
4.10
4.10
Dec 12, 2017
5:30 PMIndia
Industrial Production YoY
% Change
Oct
3.80
Source: Bloomberg, Angel Research
Market Outlook
December 1, 2017
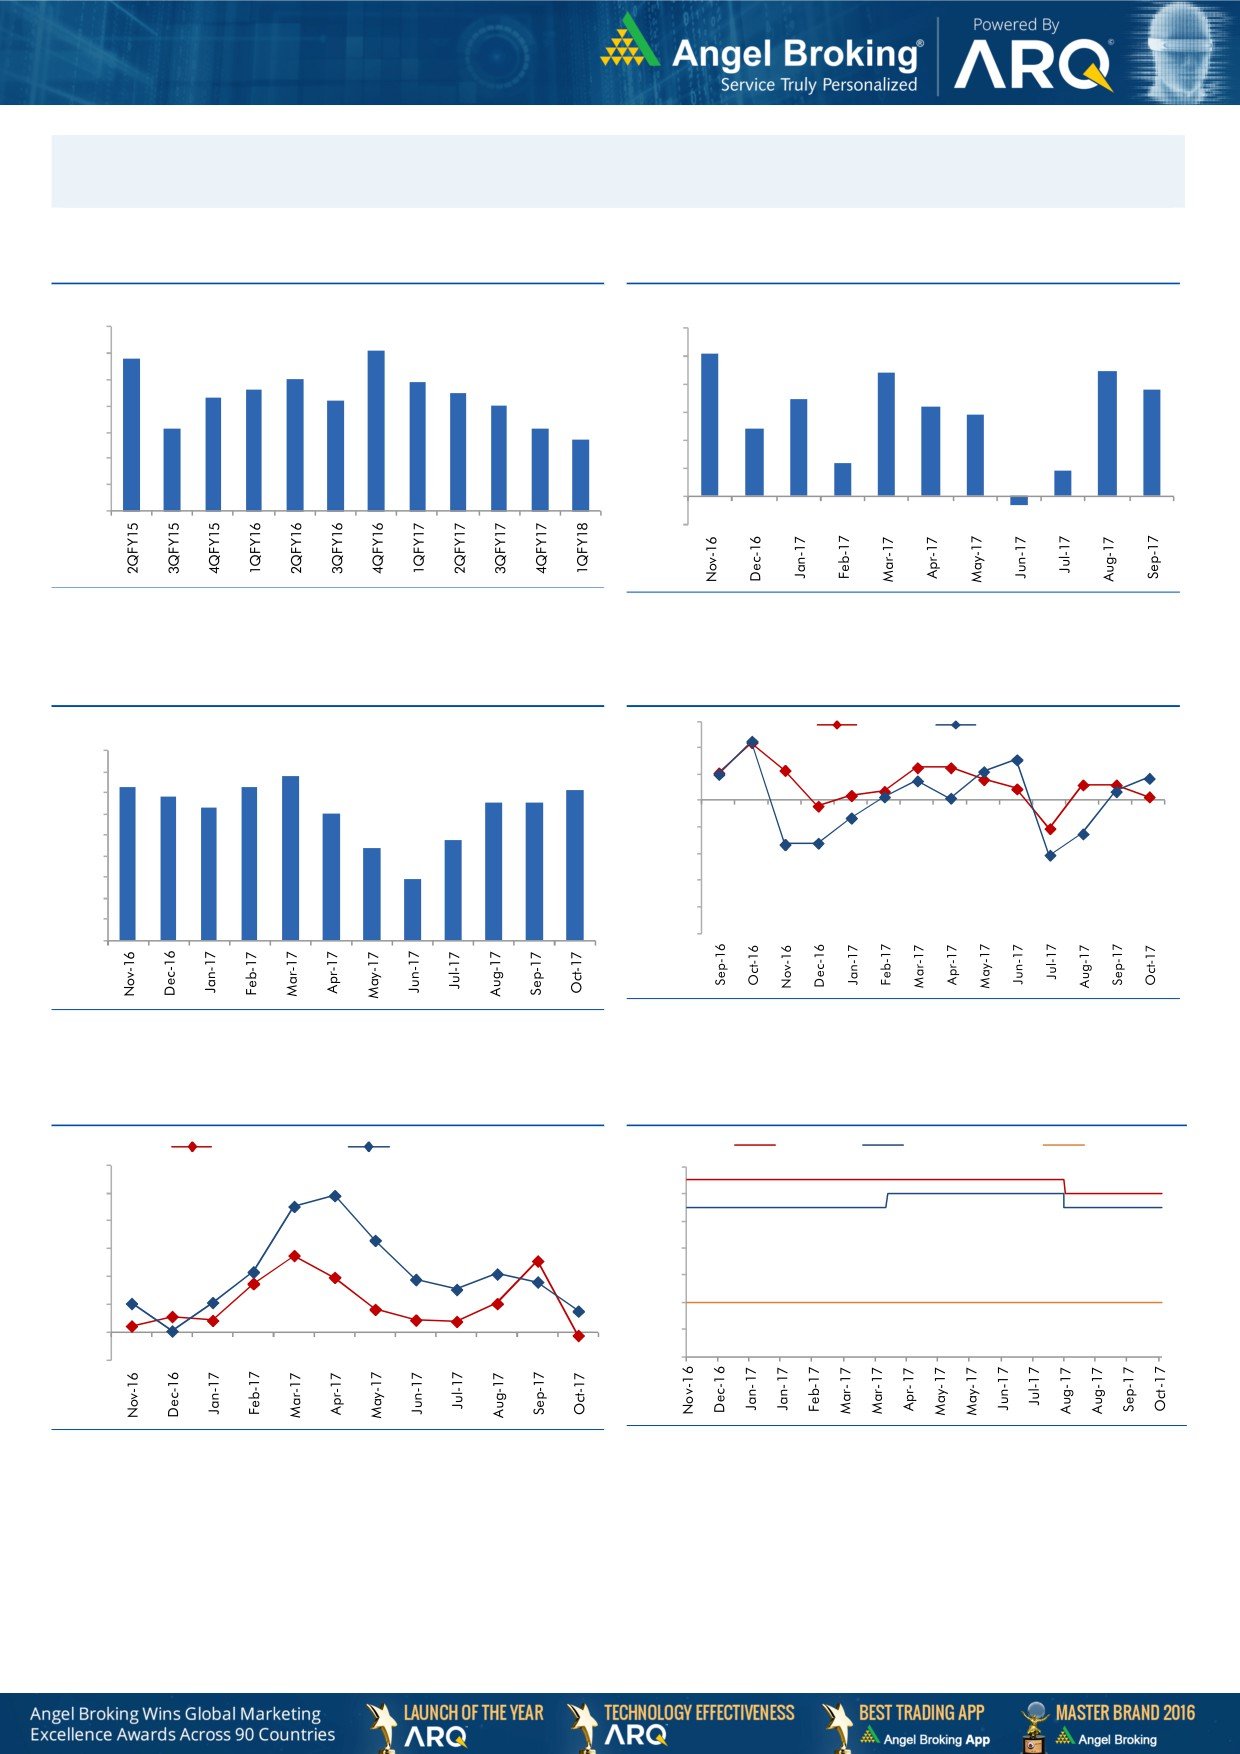
Macro watch
Exhibit 1: Quarterly GDP trends
Exhibit 2: IIP trends
(%)
(%)
10.0
6.0
9.1
5.1
8.8
9.0
5.0
4.4
4.5
8.0
7.9
7.6
7.5
3.8
8.0
7.3
3.5
7.2
7.0
4.0
3.2
2.9
7.0
6.1
6.1
3.0
2.4
5.7
6.0
2.0
1.2
5.0
0.9
1.0
4.0
-
3.0
(1.0)
(0.3)
Source: CSO, Angel Research
Source: MOSPI, Angel Research
Exhibit 3: Monthly CPI inflation trends
Exhibit 4: Manufacturing and services PMI
56.0
Mfg. PMI
Services PMI
(%)
4.5
54.0
3.9
4.0
3.6
3.7
3.6
52.0
3.4
3.2
3.3
3.3
3.5
3.0
50.0
3.0
2.4
48.0
2.5
2.2
2.0
46.0
1.5
1.5
44.0
1.0
42.0
0.5
40.0
-
Source: Market, Angel Research; Note: Level above 50 indicates expansion
Source: MOSPI, Angel Research
Exhibit 5: Exports and imports growth trends
Exhibit 6: Key policy rates
(%)
Exports yoy growth
Imports yoy growth
(%)
Repo rate
Reverse Repo rate
CRR
60.0
6.50
50.0
6.00
40.0
5.50
30.0
5.00
20.0
4.50
10.0
4.00
0.0
3.50
(10.0)
3.00
Source: Bloomberg, Angel Research
Source: RBI, Angel Research
Market Outlook
December 1, 2017
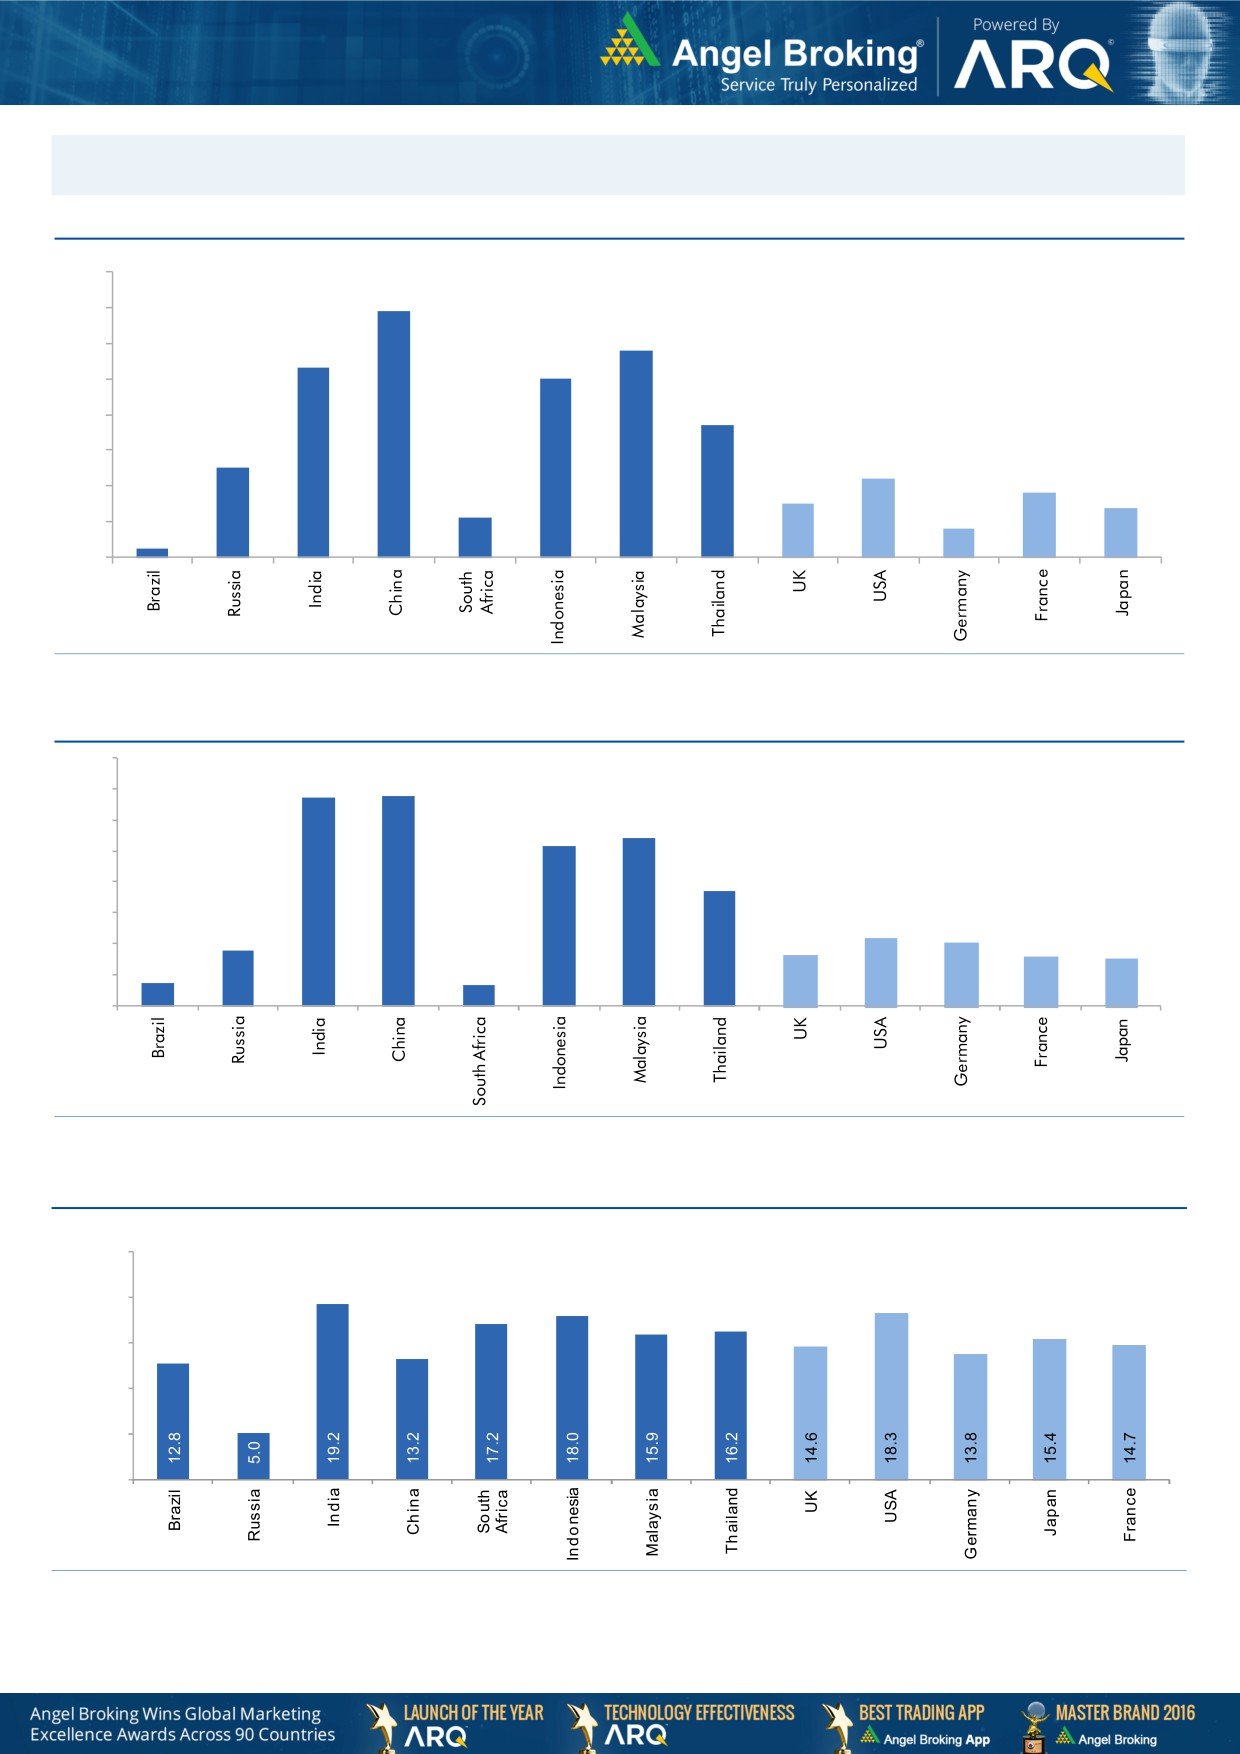
Global watch
Exhibit 1: Latest quarterly GDP Growth (%, yoy) across select developing and developed countries
(%)
8.0
6.9
7.0
5.8
6.0
5.3
5.0
5.0
1.1
3.7
4.0
2.5
3.0
2.2
1.8
2.0
1.5
1.4
0.8
1.0
0.3
-
Source: Bloomberg, Angel Research
Exhibit 2: 2017 GDP Growth projection by IMF (%, yoy) across select developing and developed countries
(%)
6.7
6.8
7.0
6.0
5.4
5.2
5.0
3.7
4.0
3.0
1.8
2.2
2.0
1.7
1.6
2.0
0.7
1.5
0.7
1.0
-
Source: IMF, Angel Research
Exhibit 3: One year forward P-E ratio across select developing and developed countries
(x)
25.0
20.0
15.0
10.0
5.0
-
Source: IMF, Angel Research
Market Outlook
December 1, 2017
Exhibit 4: Relative performance of indices across globe
Returns (%)
Country
Name of index
Closing price
1M
3M
1YR
Brazil
Bovespa
71,971
(5.2)
2.2
18.4
Russia
Micex
2,101
2.7
4.9
(0.4)
India
Nifty
10,227
(1.1)
3.5
25.6
China
Shanghai Composite
3,317
(2.2)
(0.4)
2.1
South Africa
Top 40
53,270
1.8
7.0
22.7
Mexico
Mexbol
47,092
(2.8)
(7.2)
6.1
Indonesia
LQ45
992
(0.0)
1.3
16.9
Malaysia
KLCI
1,718
(1.7)
(2.9)
5.4
Thailand
SET 50
1,086
(0.8)
4.9
17.3
USA
Dow Jones
24,272
2.2
9.5
25.2
UK
FTSE
7,327
(2.2)
(1.5)
8.9
Japan
Nikkei
22,725
3.3
16.8
24.0
Germany
DAX
13,024
(0.5)
9.7
23.2
France
CAC
5,373
(1.5)
5.8
14.5
Source: Bloomberg, Angel Research p68in4
Stock Watch
December 01, 2017
Company Name
Reco
CMP
Target
Mkt Cap
Sales ( Čcr )
OPM(%)
EPS (Č)
PER(x)
P/BV(x)
RoE(%)
EV/Sales(x)
(Č)
Price ( Č)
( Č cr )
FY18E FY19E
FY18E
FY19E
FY18E
FY19E
FY18E
FY19E
FY18E
FY19E
FY18E
FY19E
FY18E
FY19E
Agri / Agri Chemical
Rallis
Reduce
245
209
4,760
1,873
2,099
15.0
15.0
9.5
10.5
25.8
23.3
3.9
3.5
15.8
16.0
2.4
2.2
United Phosphorus
Accumulate
733
820
37,280
18,922
21,949
18.0
18.5
36.2
45.6
20.3
16.1
4.2
3.5
22.7
23.8
2.1
1.8
Auto & Auto Ancillary
Ashok Leyland
Accumulate
118
127
34,525
23,339
27,240
10.1
10.8
4.7
6.2
25.4
19.0
5.1
4.5
20.0
23.6
1.4
1.2
Bajaj Auto
Neutral
3,312
-
95,830
23,936
27,955
19.5
20.1
142.7
167.3
23.2
19.8
5.1
4.5
21.8
22.8
3.6
3.0
Bharat Forge
Buy
694
875
32,317
7,637
8,755
21.7
23.2
36.1
47.3
19.2
14.7
3.5
2.9
18.5
20.8
4.1
3.5
Eicher Motors
Neutral
29,944
-
81,515
19,043
22,837
19.5
19.9
835.4
1,019.0
35.9
29.4
13.4
10.3
40.9
37.8
4.2
3.4
Gabriel India
Neutral
186
-
2,665
1,782
2,033
9.7
10.2
7.1
8.9
26.1
21.0
5.3
4.5
21.0
22.2
1.4
1.2
Hero Motocorp
Accumulate
3,642
4,129
72,739
32,239
36,878
16.0
15.6
184.4
206.5
19.8
17.6
6.2
5.4
31.3
30.7
2.0
1.7
Jamna Auto Industries Neutral
63
-
2,520
1,441
1,662
14.4
14.8
13.9
17.6
4.6
3.6
1.2
1.0
30.0
31.0
1.7
1.5
Mahindra and Mahindra Neutral
1,411
-
87,676
46,971
53,816
13.6
14.0
67.7
79.8
20.8
17.7
3.0
2.7
15.0
15.9
1.8
1.5
Maruti
Accumulate
8,602
9,489
259,858
79,470
95,208
15.9
17.2
281.7
363.8
30.5
23.7
6.6
5.4
21.7
22.8
2.9
2.4
Minda Industries
Neutral
1,248
-
10,789
4,328
5,084
11.0
11.9
27.3
36.4
45.8
34.3
9.7
7.6
23.1
25.6
2.6
2.2
Motherson Sumi
Neutral
364
-
76,712
55,937
64,445
10.8
11.4
16.9
21.1
21.6
17.3
4.8
4.9
25.2
25.4
1.4
1.2
Tata Motors
Neutral
405
-
116,837
303,167
343,649
11.8
13.8
33.1
54.7
12.2
7.4
2.0
1.6
16.9
23.0
0.4
0.4
TVS Motor
Neutral
719
-
34,149
13,992
16,216
9.0
9.4
17.1
20.3
42.2
35.4
11.2
8.7
29.7
27.7
2.4
2.0
Amara Raja Batteries
Accumulate
799
858
13,649
6,140
7,122
14.3
15.6
29.3
39.0
27.3
20.5
4.7
3.9
17.1
19.0
2.2
1.9
Exide Industries
Neutral
205
-
17,455
8,689
9,854
15.1
15.2
9.7
11.0
21.3
18.7
3.8
3.3
15.7
16.1
1.7
1.5
Apollo Tyres
Neutral
251
-
14,341
15,739
17,326
13.3
14.6
20.4
26.7
12.3
9.4
1.5
1.3
20.4
26.7
1.1
1.0
Ceat
Neutral
1,791
-
7,243
6,661
7,717
11.1
14.2
116.2
178.2
15.4
10.1
2.7
2.2
15.2
21.3
1.2
1.0
JK Tyres
Neutral
144
-
3,255
8,318
9,239
16.2
16.4
21.0
27.5
6.9
5.2
1.3
1.1
19.1
20.4
0.8
0.7
Swaraj Engines
Neutral
1,963
-
2,438
788
889
16.4
16.5
71.6
81.0
27.4
24.3
7.9
7.3
29.6
31.0
2.8
2.4
Subros
Neutral
262
-
1,570
1,855
2,135
11.6
11.8
10.3
14.7
25.5
17.9
3.9
3.3
15.8
19.1
1.1
0.9
Capital Goods
BEML
Neutral
1,666
-
6,940
4,286
5,194
7.1
8.2
42.9
58.1
38.8
28.7
3.2
2.9
7.6
8.7
1.7
1.4
Bharat Electronics
Neutral
186
-
45,651
10,258
12,470
19.6
19.5
7.3
8.6
25.5
21.6
0.5
0.4
20.4
21.9
4.0
3.2
Voltas
Neutral
637
-
21,067
6,778
8,004
9.6
11.0
17.1
22.4
37.2
28.4
8.9
7.8
17.7
19.8
2.8
2.4
BHEL
Neutral
92
-
33,740
33,200
39,167
6.8
9.5
6.2
11.2
14.8
8.2
0.7
0.7
4.6
8.0
0.6
0.5
Blue Star
Buy
739
867
7,085
5,220
6,207
6.3
6.6
16.8
22.3
44.0
33.2
8.7
7.7
19.9
23.3
1.3
1.1
CG Power and Industrial
Neutral
87
-
5,424
6,555
7,292
7.5
7.5
-
0.8
8,655.0
108.2
1.3
1.4
0.1
1.2
0.9
0.8
Solutions
Greaves Cotton
Neutral
121
-
2,957
1,778
1,993
14.7
15.1
8.1
9.1
15.0
13.3
3.4
3.1
21.8
23.6
1.4
1.3
Stock Watch
December 01, 2017
Company Name
Reco
CMP
Target
Mkt Cap
Sales ( Čcr )
OPM(%)
EPS (Č)
PER(x)
P/BV(x)
RoE(%)
EV/Sales(x)
(Č)
Price ( Č)
( Č cr )
FY18E FY19E
FY18E
FY19E
FY18E
FY19E
FY18E
FY19E
FY18E
FY19E
FY18E
FY19E
FY18E
FY19E
Capital Goods
KEC International
Accumulate
322
350
8,265
9,779
11,113
9.4
9.8
14.2
18.2
22.6
17.7
4.3
3.6
21.1
22.1
1.1
1.0
KEI Industries
Accumulate
397
425
3,111
3,001
3,391
10.0
10.0
13.0
16.1
30.5
24.6
5.6
4.6
18.2
18.7
1.2
1.1
Thermax
Neutral
1,107
-
13,191
4,125
4,747
10.3
10.8
26.7
31.5
41.5
35.1
4.6
4.2
11.2
12.0
2.9
2.5
VATech Wabag
Accumulate
604
681
3,296
3,867
4,126
9.6
10.0
34.9
39.8
17.3
15.2
2.9
2.5
17.7
17.5
0.9
0.8
Cement
ACC
Neutral
1,667
-
31,295
12,255
13,350
13.5
14.3
58.0
66.2
28.7
25.2
3.4
3.2
11.5
12.2
2.5
2.3
Ambuja Cements
Neutral
263
-
52,143
10,250
11,450
17.5
19.0
7.2
8.3
36.5
31.6
2.6
2.5
7.0
7.8
4.9
4.3
India Cements
Neutral
174
-
5,357
6,135
6,750
14.8
15.2
8.5
11.5
20.5
15.1
1.0
1.0
4.8
6.2
1.2
1.1
JK Cement
Neutral
997
-
6,970
4,150
4,775
19.2
20.0
49.0
63.5
20.4
15.7
3.2
2.8
17.0
18.5
2.1
1.8
J K Lakshmi Cement
Neutral
409
-
4,812
3,422
3,757
15.5
17.0
13.5
23.2
30.3
17.6
3.2
2.7
10.8
15.5
1.8
1.6
Orient Cement
Neutral
163
-
3,335
2,215
3,233
16.8
17.0
5.9
6.9
27.6
23.6
2.1
2.0
10.8
10.1
2.5
1.7
UltraTech Cement
Neutral
4,211
-
115,613
28,250
35,150
20.2
23.5
77.5
122.2
54.3
34.5
4.6
4.2
9.6
14.8
4.6
3.6
Construction
KNR Constructions
Neutral
275
-
3,868
1,846
2,203
14.5
14.5
12.1
13.7
22.7
20.2
1.2
1.1
17.5
16.7
2.1
1.8
Larsen & Toubro
Neutral
1,217
-
170,485
95,787
109,476
10.2
11.6
44.5
50.8
27.4
24.0
3.4
3.2
12.9
13.1
2.3
2.1
Gujarat Pipavav Port
Neutral
144
-
6,974
739
842
61.6
62.7
5.1
6.2
28.3
23.5
3.5
3.4
12.7
14.9
8.9
7.7
PNC Infratech
Neutral
193
-
4,951
2,040
2,935
13.0
13.0
6.4
9.0
30.2
21.4
0.8
0.7
9.7
12.2
2.4
1.7
Simplex Infra
Neutral
564
-
2,788
6,012
6,619
11.6
11.7
21.1
31.0
26.8
18.2
1.9
1.7
6.5
8.6
1.0
0.9
Sadbhav Engineering
Neutral
380
-
6,514
3,823
4,426
10.7
10.8
10.3
11.8
36.9
32.2
4.4
3.9
10.1
10.5
2.0
1.8
NBCC
Neutral
263
-
23,657
9,099
12,706
6.4
6.4
7.3
9.6
36.1
27.5
1.6
1.3
27.5
30.5
2.5
1.8
MEP Infra
Neutral
99
-
1,613
2,403
2,910
18.3
16.8
2.4
6.1
42.2
16.3
16.0
10.8
35.2
55.8
1.8
1.5
SIPL
Neutral
136
-
4,796
2,060
2,390
46.8
47.7
(5.8)
(3.1)
5.1
5.8
(14.2)
(2.3)
7.1
6.6
Engineers India
Neutral
188
-
12,642
1,795
2,611
21.1
22.4
5.9
8.1
31.8
23.2
2.3
2.2
12.9
16.1
5.4
3.6
Financials
Axis Bank
Accumulate
536
580
128,549
32,558
35,843
3.5
3.2
27.8
41.0
19.3
13.1
2.1
1.8
11.4
14.9
-
-
Bank of Baroda
Neutral
169
-
38,952
22,533
26,079
2.4
2.4
12.0
20.9
14.1
8.1
0.9
0.9
6.6
11.0
-
-
Canara Bank
Neutral
373
-
22,303
17,925
20,235
2.0
2.1
18.5
36.5
20.2
10.2
0.8
0.7
3.4
6.2
-
-
Can Fin Homes
Neutral
484
-
6,436
586
741
3.5
3.5
107.8
141.0
4.5
3.4
1.0
0.8
24.1
25.6
-
-
Cholamandalam Inv. &
Neutral
1,275
-
19,932
2,826
3,307
6.3
6.3
53.7
64.6
23.8
19.8
4.0
3.5
18.3
18.9
-
-
Fin. Co.
Dewan Housing Finance Buy
617
712
19,346
2,676
3,383
2.4
2.7
37.4
49.7
16.5
12.4
2.2
1.9
13.8
16.2
-
-
Equitas Holdings
Buy
148
235
5,011
1,125
1,380
9.6
9.8
1.5
6.0
98.4
24.6
2.2
2.1
2.4
8.2
-
-
Federal Bank
Accumulate
111
125
21,721
4,896
5,930
2.8
3.1
5.4
7.6
20.6
14.6
1.8
1.6
8.5
11.0
-
-
Stock Watch
December 01, 2017
Company Name
Reco
CMP
Target
Mkt Cap
Sales ( Čcr )
OPM(%)
EPS (Č)
PER(x)
P/BV(x)
RoE(%)
EV/Sales(x)
(Č)
Price ( Č)
( Č cr )
FY18E FY19E
FY18E
FY19E
FY18E
FY19E
FY18E
FY19E
FY18E
FY19E
FY18E
FY19E
FY18E
FY19E
Financials
GIC Housing
Buy
440
655
2,372
376
477
3.6
3.7
33.0
40.0
13.4
11.0
2.4
2.0
20.0
23.0
-
-
HDFC Bank
Neutral
1,852
-
478,950
55,236
63,253
4.5
4.4
68.9
82.4
26.9
22.5
4.7
3.9
18.7
18.5
-
-
ICICI Bank
Neutral
308
-
197,623
42,361
51,378
3.6
3.9
18.4
25.7
16.8
12.0
1.8
1.8
11.3
15.0
-
-
Karur Vysya Bank
Buy
114
180
6,883
3,289
3,630
3.7
3.9
10.8
14.1
10.5
8.1
1.3
1.1
12.5
14.7
-
-
LIC Housing Finance
Accumulate
584
630
29,493
4,895
6,332
3.4
3.7
50.7
66.8
11.5
8.8
2.3
1.9
21.7
23.8
-
-
Punjab Natl.Bank
Neutral
176
-
37,484
23,708
25,758
2.1
2.1
5.9
16.4
30.0
10.7
0.9
0.8
3.0
8.3
-
-
RBL Bank
Neutral
517
-
21,517
2,309
2,888
2.6
2.5
16.4
19.1
31.6
27.1
4.0
3.5
13.3
13.8
-
-
Repco Home Finance
Buy
628
825
3,929
496
597
4.4
4.2
38.5
48.7
16.3
12.9
2.9
2.4
19.6
20.6
-
-
South Ind.Bank
Neutral
33
-
5,932
3,195
3,567
3.0
3.1
3.0
3.8
10.9
8.6
1.1
1.0
10.5
11.9
-
-
St Bk of India
Neutral
320
-
276,614
105,827
121,056
2.4
2.5
16.1
25.6
19.9
12.5
1.6
1.4
6.6
9.9
-
-
Union Bank
Neutral
164
-
11,939
14,650
16,225
2.3
2.3
23.1
32.5
7.1
5.1
0.5
0.5
7.1
9.2
-
-
Yes Bank
Neutral
307
-
70,491
11,088
13,138
3.0
2.9
84.0
99.3
3.7
3.1
0.6
0.5
16.3
16.8
-
-
FMCG
Akzo Nobel India
Neutral
1,790
-
8,585
3,164
3,607
13.8
13.7
58.6
67.9
30.6
26.4
7.5
6.6
24.5
25.1
2.6
2.2
Asian Paints
Neutral
1,148
-
110,092
17,603
20,615
18.6
18.6
2,128.9
2,543.3
0.5
0.5
11.4
9.6
28.0
28.9
6.1
5.1
Britannia
Neutral
4,783
-
57,421
9,690
11,278
14.8
15.4
84.0
101.0
56.9
47.4
20.7
16.5
40.6
39.0
5.9
5.1
Colgate
Neutral
1,037
-
28,205
4,420
5,074
24.9
25.3
28.6
32.8
36.3
31.6
14.3
11.6
43.8
40.5
6.1
5.3
Dabur India
Neutral
347
-
61,090
8,346
9,344
19.6
19.9
7.8
9.0
44.5
38.5
9.0
8.1
25.2
24.8
6.9
6.1
GlaxoSmith Con*
Neutral
6,092
-
25,622
5,072
5,760
18.2
18.4
176.3
199.2
34.6
30.6
7.3
6.6
21.2
21.7
4.4
3.8
Godrej Consumer
Neutral
961
-
65,506
10,171
11,682
20.8
21.5
21.7
27.1
44.3
35.5
10.0
8.6
22.3
23.4
6.6
5.7
HUL
Neutral
1,274
-
275,701
37,077
41,508
20.3
21.8
5,189.9
6,318.5
0.3
0.2
38.8
33.2
74.8
82.0
7.3
6.5
ITC
Neutral
256
-
311,523
44,588
49,853
37.0
37.3
9.6
11.0
26.6
23.2
6.5
6.2
25.1
27.3
6.5
5.8
Marico
Neutral
306
-
39,459
6,788
7,766
18.5
19.2
7.1
8.5
43.1
36.0
15.1
12.9
36.9
38.0
5.7
4.9
Nestle*
Neutral
7,650
-
73,758
10,083
11,182
20.0
20.9
119.7
141.3
63.9
54.1
225.2
205.9
36.7
39.8
7.0
6.3
Tata Global
Neutral
287
-
18,120
7,121
7,641
11.9
12.3
6.9
8.0
41.6
35.9
2.8
2.7
6.8
7.2
2.3
2.2
Procter & Gamble
Neutral
9,355
-
30,367
3,034
3,579
27.1
27.7
167.7
198.8
55.8
47.1
15.0
12.9
28.8
29.5
9.4
7.9
Hygiene
IT
HCL Tech^
Buy
848
1,014
121,001
50,009
54,608
22.1
22.1
62.8
67.6
13.5
12.5
3.0
2.6
22.4
20.6
2.1
1.8
Infosys
Accumulate
975
1,120
223,945
70,333
75,960
26.0
26.0
61.7
65.9
15.8
14.8
3.0
2.8
18.9
18.7
2.6
2.3
TCS
Reduce
2,634
2,442
504,271
123,384
134,488
26.1
26.1
133.2
143.7
19.8
18.3
5.5
5.1
27.6
27.8
3.7
3.4
Tech Mahindra
Accumulate
489
526
47,782
30,545
32,988
15.0
15.0
35.2
37.6
13.9
13.0
2.3
2.2
16.8
16.2
1.3
1.2
Stock Watch
December 01, 2017
Company Name
Reco
CMP
Target
Mkt Cap
Sales ( Čcr )
OPM(%)
EPS (Č)
PER(x)
P/BV(x)
RoE(%)
EV/Sales(x)
(Č)
Price ( Č)
( Č cr )
FY18E FY19E
FY18E
FY19E
FY18E
FY19E
FY18E
FY19E
FY18E
FY19E
FY18E
FY19E
FY18E
FY19E
IT
Wipro
Neutral
292
-
142,010
54,164
56,544
22.3
22.3
18.8
19.5
15.5
15.0
2.5
2.1
15.0
13.6
1.9
1.6
Media
D B Corp
Neutral
361
-
6,642
2,404
2,625
30.5
31.5
23.7
26.9
15.2
13.4
3.6
3.1
23.5
22.8
2.6
2.4
HT Media
Neutral
99
-
2,315
2,589
2,830
15.1
15.4
8.3
10.9
12.0
9.1
1.0
0.9
8.4
10.4
0.4
0.3
Jagran Prakashan
Buy
166
225
5,168
2,541
2,835
28.5
28.7
12.7
14.1
13.1
11.8
2.7
2.3
21.3
21.4
1.9
1.6
Sun TV Network
Neutral
870
-
34,281
3,238
3,789
51.9
55.1
30.9
38.0
28.2
22.9
8.0
7.0
30.0
31.0
10.1
8.5
Hindustan Media
Neutral
247
-
1,813
1,002
1,074
23.3
23.5
29.2
33.8
8.5
7.3
1.3
1.1
15.6
15.4
0.8
0.5
Ventures
TV Today Network
Accumulate
395
435
2,357
667
727
27.7
27.7
18.6
20.1
21.2
19.7
3.3
3.4
15.6
17.3
3.1
2.9
Music Broadcast Limited Accumulate
382
434
2,178
271
317
91.0
109.0
6.0
10.0
63.6
38.2
4.0
3.6
6.5
9.3
7.6
6.3
Metals & Mining
Coal India
Neutral
276
-
171,449
82,301
91,235
17.0
18.0
17.1
20.5
16.2
13.5
3.0
2.9
45.0
55.0
1.8
1.6
Hind. Zinc
Neutral
300
-
126,612
22,108
24,555
57.0
58.0
22.1
26.3
13.6
11.4
4.4
3.6
32.0
35.0
4.7
3.9
Hindalco
Neutral
240
-
53,953
102,350
105,355
13.5
14.5
21.5
24.5
11.2
9.8
1.5
1.3
15.0
15.2
1.1
1.1
JSW Steel
Neutral
255
-
61,518
64,500
68,245
21.1
21.5
20.1
21.2
12.7
12.0
2.3
2.0
-
-
1.7
1.6
NMDC
Neutral
128
-
40,435
10,209
11,450
47.0
48.0
11.1
12.1
11.5
10.6
1.6
1.5
-
-
3.5
3.1
SAIL
Neutral
77
-
31,740
54,100
63,555
3.0
10.0
(10.0)
1.5
51.2
1.0
1.0
-
-
1.6
1.4
Vedanta
Neutral
295
-
109,825
81,206
87,345
28.0
29.0
26.5
33.5
11.2
8.8
2.5
2.2
-
-
2.1
1.8
Tata Steel
Neutral
695
-
67,514
121,445
126,500
16.2
17.2
65.4
81.3
10.6
8.6
1.7
1.4
-
-
1.1
1.0
Oil & Gas
GAIL
Neutral
469
-
79,271
53,115
52,344
14.2
15.3
30.0
31.1
15.6
15.1
2.0
1.8
-
-
1.2
1.2
ONGC
Neutral
181
-
231,704
83,111
84,934
44.2
44.9
16.4
16.9
11.0
10.7
1.3
1.2
-
-
2.7
2.6
Indian Oil Corp
Neutral
394
-
191,080
396,116
432,560
8.5
8.8
40.1
42.2
9.8
9.3
1.7
1.5
-
-
0.6
0.6
Reliance Industries
Neutral
923
-
600,041
257,711
267,438
17.0
18.2
89.1
89.5
10.4
10.3
1.0
0.9
-
-
2.0
1.9
Pharmaceuticals
Alembic Pharma
Buy
520
600
9,803
3,346
3,915
19.6
19.2
21.0
23.9
24.8
21.8
4.4
3.7
19.1
18.4
2.9
2.5
Alkem Laboratories Ltd
Accumulate
1,987
2,125
23,759
6,320
7,341
17.5
19.8
72.7
96.6
27.3
20.6
4.8
4.1
16.7
18.7
3.7
3.1
Aurobindo Pharma
Buy
695
823
40,701
17,086
19,478
22.1
22.0
44.7
51.4
15.5
13.5
3.4
2.8
24.7
22.7
2.5
2.2
Aventis*
Neutral
4,413
-
10,163
2,411
2,698
18.8
18.8
151.6
163.9
29.1
26.9
4.5
3.7
25.4
27.5
3.8
3.2
Cadila Healthcare
Neutral
429
-
43,960
11,365
12,926
20.0
20.0
18.4
20.5
23.3
21.0
5.1
4.2
24.3
22.2
4.0
3.4
Cipla
Sell
600
462
48,317
16,163
18,711
16.6
16.9
20.7
24.3
29.0
24.7
3.5
3.1
12.6
13.1
3.1
2.7
Dr Reddy's
Reduce
2,286
2,040
37,913
13,734
15,548
17.7
20.2
69.9
102.0
32.7
22.4
2.9
2.7
9.2
12.4
3.0
2.6
GSK Pharma*
Sell
2,479
2,000
20,996
2,968
3,324
13.8
15.9
37.8
46.3
65.6
53.5
11.5
12.6
16.7
22.4
6.9
6.3
Indoco Remedies
Sell
276
136
2,546
1,114
1,297
9.9
13.9
5.6
11.4
49.3
24.2
3.7
3.3
7.7
14.5
2.6
2.2
Stock Watch
December 01, 2017
Company Name
Reco
CMP
Target
Mkt Cap
Sales ( Čcr )
OPM(%)
EPS (Č)
PER(x)
P/BV(x)
RoE(%)
EV/Sales(x)
(Č)
Price ( Č)
( Č cr )
FY18E FY19E
FY18E
FY19E
FY18E
FY19E
FY18E
FY19E
FY18E
FY19E
FY18E
FY19E
FY18E
FY19E
Pharmaceuticals
Ipca labs
Accumulate
541
570
6,828
3,256
3,647
14.1
17.1
16.2
25.4
33.4
21.3
2.6
2.3
8.0
11.5
2.2
1.9
Lupin
Buy
819
1,091
37,009
16,240
18,562
21.3
21.7
42.5
49.6
19.3
16.5
2.4
2.1
13.3
13.7
2.4
2.0
Natco Pharma
Accumulate
941
1,057
16,412
1,886
2,016
32.3
29.5
23.2
22.0
40.6
42.7
8.5
7.5
20.9
17.6
8.6
8.0
Sun Pharma
Accumulate
540
615
129,547
28,312
31,826
20.7
22.4
18.5
22.3
29.2
24.2
3.3
3.0
11.5
14.0
4.2
3.6
Syngene International
Neutral
554
-
11,080
1,394
1,818
33.0
36.0
15.8
20.6
35.0
26.9
6.5
5.4
18.6
20.0
7.9
6.1
Power
Tata Power
Neutral
95
-
25,614
32,547
33,806
20.5
20.5
4.7
5.4
20.2
17.7
1.9
1.7
10.5
10.5
1.8
1.7
NTPC
Neutral
181
-
149,160
86,070
101,246
28.3
30.7
12.9
16.2
14.0
11.2
1.4
1.3
10.6
12.4
3.1
2.8
Power Grid
Accumulate
206
223
107,745
29,183
32,946
89.7
90.0
18.0
20.8
11.5
9.9
1.9
1.7
17.7
18.2
7.6
7.1
Real Estate
Prestige Estate
Neutral
330
-
12,377
4,607
5,146
21.0
22.2
7.9
9.8
41.8
33.7
2.6
2.4
10.3
12.0
3.9
3.5
MLIFE
Accumulate
479
522
2,456
487
590
12.3
17.8
21.0
31.2
22.8
15.3
1.2
1.1
5.2
7.4
3.8
3.1
Telecom
Bharti Airtel
Neutral
497
-
198,611
97,903
105,233
36.0
36.3
9.3
11.1
53.4
45.0
2.6
2.4
5.0
5.6
3.0
2.7
Idea Cellular
Neutral
94
-
33,999
35,012
37,689
27.1
27.7
(4.4)
(2.7)
1.5
1.5
(6.8)
(4.6)
2.3
2.1
zOthers
Abbott India
Neutral
5,267
-
11,191
3,244
3,723
14.9
16.1
167.5
209.4
31.4
25.2
6.9
5.8
23.7
24.8
3.1
2.6
Asian Granito
Accumulate
509
570
1,531
1,169
1,286
12.5
12.5
16.0
19.7
31.9
25.8
3.4
3.0
10.7
11.6
1.5
1.4
Bajaj Electricals
Neutral
469
-
4,774
4,646
5,301
6.7
7.6
16.1
22.3
29.2
21.1
4.8
4.1
16.4
19.2
1.0
0.9
Banco Products (India)
Neutral
253
-
1,811
1,530
1,695
13.2
12.7
19.0
20.0
13.3
12.7
2.1
1.9
0.2
0.2
1.1
122.3
Coffee Day Enterprises
Neutral
246
-
5,068
3,494
3,913
17.4
18.0
4.8
5.7
-
43.2
2.2
2.1
-
0.1
1.9
1.7
Ltd
Elecon Engineering
Neutral
80
-
898
171
201
15.0
16.2
36.0
43.0
2.2
1.9
0.2
0.2
0.1
0.1
4.6
3.9
Garware Wall Ropes
Neutral
921
-
2,015
928
1,003
15.2
15.2
39.4
43.2
23.4
21.3
3.9
3.3
16.5
15.4
2.0
1.8
Goodyear India*
Neutral
859
-
1,982
1,717
1,866
11.8
12.3
47.9
49.8
17.9
17.3
2.8
2.4
15.6
15.7
0.9
121.7
Hitachi
Neutral
2,547
-
6,926
2,355
2,715
10.3
10.8
49.0
60.9
52.0
41.8
12.2
9.6
0.2
0.2
3.0
2.6
HSIL
Neutral
513
-
3,711
2,240
2,670
14.6
15.0
17.0
22.0
30.2
23.3
2.5
2.4
0.1
0.1
1.9
1.5
Interglobe Aviation
Neutral
1,125
-
43,226
22,570
27,955
14.2
15.0
63.6
81.8
17.7
13.8
9.3
7.9
0.5
0.6
1.6
1.2
Jyothy Laboratories
Neutral
377
-
6,859
1,781
2,044
14.1
15.0
9.4
10.5
40.4
35.9
8.6
8.1
0.2
0.2
4.1
3.5
Linc Pen & Plastics
Neutral
291
-
430
420
462
9.3
9.3
15.3
17.1
19.0
17.0
3.2
3.3
16.9
19.5
1.1
1.0
M M Forgings
Neutral
927
-
1,119
542
642
20.1
21.0
41.6
56.8
22.3
16.3
3.1
2.6
0.1
0.2
2.5
2.2
Mirza International
Neutral
159
-
1,910
1,148
1,285
18.0
18.0
8.0
9.4
19.8
17.0
3.3
2.8
16.3
16.1
1.8
1.6
Navkar Corporation
Buy
185
265
2,777
561
617
41.5
41.5
11.5
12.7
16.0
14.5
1.7
1.5
10.5
10.4
5.7
5.0
Nilkamal
Neutral
1,762
-
2,630
2,317
2,525
11.4
11.1
96.0
105.0
18.4
16.8
3.1
2.7
0.2
0.2
1.1
1.0
Stock Watch
December 01, 2017
Company Name
Reco
CMP
Target Mkt Cap
Sales ( Čcr )
OPM(%)
EPS (Č)
PER(x)
P/BV(x)
RoE(%)
EV/Sales(x)
(Č)
Price ( Č)
( Č cr )
FY18E FY19E FY18E FY19E FY18E FY19E FY18E FY19E FY18E FY19E FY18E FY19E FY18E FY19E
zOthers
Parag Milk Foods
Neutral
241
-
2,024
1,987
2,379
7.6
9.0
12.4
18.3
19.4
13.2
2.7
2.4
8.2
13.2
1.1
1.0
Radico Khaitan
Neutral
284
-
3,776
1,811
1,992
13.2
13.2
8.1
8.8
35.0
32.2
3.5
3.9
10.1
12.0
2.4
2.2
Relaxo Footwears
Neutral
606
-
7,295
1,981
2,310
13.7
14.5
12.0
15.5
50.5
39.1
9.8
8.0
0.2
0.2
3.7
3.2
Siyaram Silk Mills
Neutral
662
-
3,105
1,769
1,981
12.7
12.7
22.6
26.2
29.3
25.3
4.5
3.9
15.5
15.5
1.9
1.7
Styrolution ABS India* Neutral
1,132
-
1,991
1,800
1,980
8.0
8.1
42.0
46.2
27.0
24.5
3.0
2.7
0.1
0.1
1.2
1.1
Surya Roshni
Neutral
383
-
1,677
4,870
5,320
7.7
7.8
22.8
28.1
16.8
13.6
2.2
1.9
0.1
0.1
0.6
0.5
TVS Srichakra
Neutral
3,326
-
2,547
2,729
2,893
12.7
12.5
248.5
265.0
13.4
12.6
3.8
3.1
0.3
0.3
0.9
0.9
Visaka Industries
Neutral
656
-
1,042
1,104
1,214
12.1
12.6
31.0
37.9
21.2
17.3
2.6
2.3
0.1
0.1
1.2
1.0
VIP Industries
Accumulate
357
400
5,047
1,450
1,693
10.4
10.5
6.5
7.8
54.6
45.7
11.5
10.1
21.1
22.1
3.5
3.0
Navin Fluorine
Accumulate
695
730
3,430
945
1,154
22.4
22.6
28.7
34.8
24.2
20.0
4.0
3.4
-
-
3.1
2.5
Source: Company, Angel Research; Note: *December year end; #September year end; &October year end; Price as on November 30, 2017
Market Outlook
December 01, 2017
Research Team Tel: 022 - 39357800
DISCLAIMER
Angel Broking Private Limited (hereinafter referred to as “Angel”) is a registered Member of National Stock Exchange of India
Limited,Bombay Stock Exchange Limited and Metropolitan Stock Exchange Limited. It is also registered as a Depository Participant with
CDSL and Portfolio Manager with SEBI. It also has registration with AMFI as a Mutual Fund Distributor. Angel Broking Private Limited is a
registered entity with SEBI for Research Analyst in terms of SEBI (Research Analyst) Regulations, 2014 vide registration number
INH000000164. Angel or its associates has not been debarred/ suspended by SEBI or any other regulatory authority for accessing
/dealing in securities Market. Angel or its associates/analyst has not received any compensation / managed or
co-managed public offering of securities of the company covered by Analyst during the past twelve months.
This document is solely for the personal information of the recipient, and must not be singularly used as the basis of any investment
decision. Nothing in this document should be construed as investment or financial advice. Each recipient of this document should make
such investigations as they deem necessary to arrive at an independent evaluation of an investment in the securities of the companies
referred to in this document (including the merits and risks involved), and should consult their own advisors to determine the merits and
risks of such an investment.
Reports based on technical and derivative analysis center on studying charts of a stock's price movement, outstanding positions and
trading volume, as opposed to focusing on a company's fundamentals and, as such, may not match with a report on a company's
fundamentals. Investors are advised to refer the Fundamental and Technical Research Reports available on our website to evaluate the
contrary view, if any.
The information in this document has been printed on the basis of publicly available information, internal data and other reliable
sources believed to be true, but we do not represent that it is accurate or complete and it should not be relied on as such, as this
document is for general guidance only. Angel Broking Pvt. Limited or any of its affiliates/ group companies shall not be in any way
responsible for any loss or damage that may arise to any person from any inadvertent error in the information contained in this report.
Angel Broking Pvt. Limited has not independently verified all the information contained within this document. Accordingly, we cannot
testify, nor make any representation or warranty, express or implied, to the accuracy, contents or data contained within this document.
While Angel Broking Pvt. Limited endeavors to update on a reasonable basis the information discussed in this material, there may be
regulatory, compliance, or other reasons that prevent us from doing so.
This document is being supplied to you solely for your information, and its contents, information or data may not be reproduced,
redistributed or passed on, directly or indirectly.
Neither Angel Broking Pvt. Limited, nor its directors, employees or affiliates shall be liable for any loss or damage that may arise from
or in connection with the use of this information.